Back اصطفاء تمزقي Arabic Разграждащ естествен отбор Bulgarian Selección disruptiva Spanish Lõhestav valik Estonian انتخاب ازهم گسیخته Persian Selección disruptiva Galician Diszruptív szelekció Hungarian Selezione diversificante Italian Dobór różnicujący Polish Seleção disruptiva Portuguese
This article needs additional citations for verification. (December 2009) |

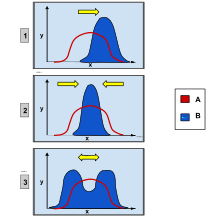
In evolutionary biology, disruptive selection, also called diversifying selection, describes changes in population genetics in which extreme values for a trait are favored over intermediate values. In this case, the variance of the trait increases and the population is divided into two distinct groups. In this more individuals acquire peripheral character value at both ends of the distribution curve.[1][2]