This article has multiple issues. Please help improve it or discuss these issues on the talk page. (Learn how and when to remove these messages)
|

2000 - May 23, 2022


Natural gas prices, as with other commodity prices, are mainly driven by supply and demand fundamentals. However, natural gas prices may also be linked to the price of crude oil and petroleum products, especially in continental Europe.[1][2] Natural gas prices in the US had historically followed oil prices, but in the recent years[when?], it has decoupled from oil and is now trending somewhat with coal prices.[3]
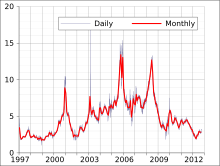
The price as at 20 January 2022, on the U.S. Henry Hub index, is US$3.87/MMBtu ($13.2/MWh).[4] The highest peak (weekly price) was US$14.49/MMBtu ($49.4/MWh) in January 2005.[5]
The 2012 surge in fracking oil and gas in the U.S. resulted in lower gas prices in the U.S. This has led to discussions in Asian oil-linked gas markets to import gas based on the Henry Hub index,[6] which was, until very recently[when?], the most widely used reference for US natural gas prices.[7]
Depending on the marketplace, the price of natural gas is often expressed in currency units per volume or currency units per energy content. For example, US dollars or other currency per million British thermal units, thousand cubic feet, or 1,000 cubic meters. Note that, for natural gas price comparisons$, per million Btu multiplied by 1.025 = $ per Mcf of pipeline-quality gas, which is what is delivered to consumers. For rough comparisons, one million Btu is approximately equal to a thousand cubic feet of natural gas.[8] Pipeline-quality gas has an energy value slightly higher than that of pure methane, which has 10.47 kilowatt-hours per cubic metre (1,012 British thermal units per cubic foot). Natural gas as it comes out of the ground is most often predominantly methane, but may have a wide range of energy values, from much lower (due to dilution by non-hydrocarbon gases) to much higher (due to the presence of ethane, propane, and heavier compounds) than standard pipeline-quality gas.[9]
- ^ "Natural gas price links to oil market frustrate regulators efforts to develop competition". New York Times. 29 October 2008.
- ^ Roben Farzad (19 April 2012). "High Oil Prices Cut the Cost of Natural Gas". Businessweek.com. Archived from the original on 22 April 2012. Retrieved 15 May 2015.
- ^ Natural Gas Price Links
- ^ "GO-TECH : Oil prices by year".
- ^ "Henry Hub Natural Gas Spot Price (Dollars per Million Btu)".
- ^ "2013 Pacific Energy Summit Working Papers". Archived from the original on 1 April 2017. Retrieved 13 May 2013.
- ^ Disavino, Scott; Krishnan, Barani (25 September 2014). "Henry Hub, king of U.S. natural gas trade, losing crown to Marcellus". Reuters. Retrieved 21 October 2014.
- ^ EIA conversion chart "$ per MM [million] Btu multiplied by 1.025 = $ per Mcf"
- ^ US Energy Information Administration, Natural gas processing plants in the United States: 2010 update, 17 June 2011.
