Back المحتوى الحراري للمحيط Arabic Contingut de calor oceànica Catalan Wärmeinhalt der Ozeane German Calentamiento de los océanos Spanish Contenu thermique des océans French Oké osimiri okpomọkụ ọdịnaya IG Топлинска содржина на океаните Macedonian Zawartość ciepła w oceanie Polish Aquecimento oceânico Portuguese Тепломісткість океану Ukrainian

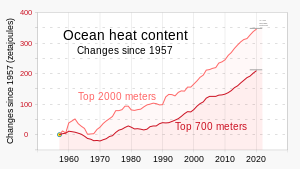
Ocean heat content (OHC) or ocean heat uptake (OHU) is the energy absorbed and stored by oceans. To calculate the ocean heat content, it is necessary to measure ocean temperature at many different locations and depths. Integrating the areal density of a change in enthalpic energy over an ocean basin or entire ocean gives the total ocean heat uptake.[2] Between 1971 and 2018, the rise in ocean heat content accounted for over 90% of Earth's excess energy from global heating.[3][4] The main driver of this increase was caused by humans via their rising greenhouse gas emissions.[5]: 1228 By 2020, about one third of the added energy had propagated to depths below 700 meters.[6][7]
In 2023, the world's oceans were again the hottest in the historical record and exceeded the previous 2022 record maximum.[8] The five highest ocean heat observations to a depth of 2000 meters occurred in the period 2019–2023. The North Pacific, North Atlantic, the Mediterranean, and the Southern Ocean all recorded their highest heat observations for more than sixty years of global measurements.[9] Ocean heat content and sea level rise are important indicators of climate change.[10]
Ocean water can absorb a lot of solar energy because water has far greater heat capacity than atmospheric gases.[6] As a result, the top few meters of the ocean contain more energy than the entire Earth's atmosphere.[11] Since before 1960, research vessels and stations have sampled sea surface temperatures and temperatures at greater depth all over the world. Since 2000, an expanding network of nearly 4000 Argo robotic floats has measured temperature anomalies, or the change in ocean heat content. With improving observation in recent decades, the heat content of the upper ocean has been analyzed to have increased at an accelerating rate.[12][13][14] The net rate of change in the top 2000 meters from 2003 to 2018 was +0.58±0.08 W/m2 (or annual mean energy gain of 9.3 zettajoules). It is difficult to measure temperatures accurately over long periods while at the same time covering enough areas and depths. This explains the uncertainty in the figures.[10]
Changes in ocean temperature greatly affect ecosystems in oceans and on land. For example, there are multiple impacts on coastal ecosystems and communities relying on their ecosystem services. Direct effects include variations in sea level and sea ice, changes to the intensity of the water cycle, and the migration of marine life.[15]
- ^ Top 700 meters: Lindsey, Rebecca; Dahlman, Luann (6 September 2023). "Climate Change: Ocean Heat Content". climate.gov. National Oceanic and Atmospheric Administration (NOAA). Archived from the original on 29 October 2023. ● Top 2000 meters: "Ocean Warming / Latest Measurement: December 2022 / 345 (± 2) zettajoules since 1955". NASA.gov. National Aeronautics and Space Administration. Archived from the original on 20 October 2023.
- ^ Cite error: The named reference
:1was invoked but never defined (see the help page). - ^ Cite error: The named reference
EarthSysSciData_20200907was invoked but never defined (see the help page). - ^ Cite error: The named reference
Chen-2021was invoked but never defined (see the help page). - ^ Cite error: The named reference
AR6_WG1_Chapter92was invoked but never defined (see the help page). - ^ a b LuAnn Dahlman and Rebecca Lindsey (2020-08-17). "Climate Change: Ocean Heat Content". National Oceanic and Atmospheric Administration.
- ^ "Study: Deep Ocean Waters Trapping Vast Store of Heat". Climate Central. 2016.
- ^ Cheng, Lijing; Abraham, John; Trenberth, Kevin E.; Boyer, Tim; Mann, Michael E.; Zhu, Jiang; Wang, Fan; Yu, Fujiang; Locarnini, Ricardo; Fasullo, John; Zheng, Fei; Li, Yuanlong; et al. (2024). "New record ocean temperatures and related climate indicators in 2023". Advances in Atmospheric Sciences. 41 (6): 1068–1082. Bibcode:2024AdAtS..41.1068C. doi:10.1007/s00376-024-3378-5. ISSN 0256-1530.
- ^ NOAA National Centers for Environmental Information, Monthly Global Climate Report for Annual 2023, published online January 2024, Retrieved on February 4, 2024 from https://www.ncei.noaa.gov/access/monitoring/monthly-report/global/202313.
- ^ a b Cheng, Lijing; Foster, Grant; Hausfather, Zeke; Trenberth, Kevin E.; Abraham, John (2022). "Improved Quantification of the Rate of Ocean Warming". Journal of Climate. 35 (14): 4827–4840. Bibcode:2022JCli...35.4827C. doi:10.1175/JCLI-D-21-0895.1.
- ^ "Vital Signs of the Plant: Ocean Heat Content". NASA. Retrieved 2021-11-15.
- ^ Cite error: The named reference
Li-2023was invoked but never defined (see the help page). - ^ Cite error: The named reference
Miniere-2023was invoked but never defined (see the help page). - ^ Cite error: The named reference
Storto-2024was invoked but never defined (see the help page). - ^ "Ocean warming : causes, scale, effects and consequences. And why it should matter to everyone. Executive summary" (PDF). International Union for Conservation of Nature. 2016.