Back خط منسوب Arabic Isollinia AST İzoxətt Azerbaijani Изолиния Bashkir Ізалінія Byelorussian Ізалінія BE-X-OLD Изолиния Bulgarian সমোন্নতি রেখা Bengali/Bangla Isolínia Catalan Izolinie Czech


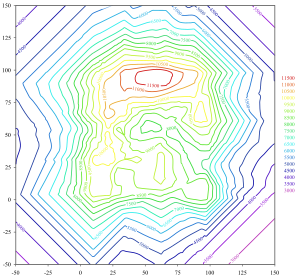
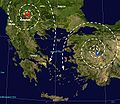
Contour lines or isolines are used when plotting a function. All the points where the function has the same value are connected. Two well-known examples, where such lines are commonly are height lines on topographical maps, and showing areas with the same pressure or temperature on weather charts. Contour lines are an application of level sets.
-
A map of Stove, with height lines
-
A map showing magnetic lines, for the year 2000
-
Temperature diagram of Norway. Areas with the same temperature have the same color
-
The 10 degree isobar is commonly used to define the Arctic region


