Back خريطة الطقس Arabic Mapa meteorològic Catalan ᏙᏱ ᏂᎦᎵᏍᏔᏂᏙᎲ ᎧᏃᎮᏍᎩ CHR نەخشەی کەشوھەوا CKB Meteorologická mapa Czech Wetterkarte German Μετεωρολογικός χάρτης Greek Weather map English Mapa meteorológico Spanish Ilmakaart Estonian

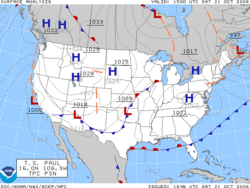
A weather map is a tool. It shows facts about the weather quickly.[1] Weather maps have been used from the mid-19th century, for study and for weather forecasting. Some maps show differences of temperature, and weather fronts.

A station model is a symbolic picture showing the weather at a reporting station. Meteorologists made the station model to put down many weather elements in a small space on weather maps. Maps thickly filled with station-model plots can be hard to read. However, they help meteorologists, pilots, and mariners to see important weather patterns. A computer draws a station model for every place of observation. The station model is mostly used for surface-weather maps. It can also be used to show the weather in the sky, though. A complete station-model map lets people study patterns in air pressure, temperature, wind, cloud cover, and precipitation.[2]
- ↑ Encarta (2009). "Chart". Microsoft Corporation. Archived from the original on 2011-05-25. Retrieved 2007-11-25.
- ↑ CoCoRAHS (2005). Introduction to Drawing Isopleths. Archived 2007-04-28 at the Wayback Machine Colorado Climate Center. Retrieved on 2007-04-29.