Back دورة قلبية Arabic Srčani ciklus BS Cicle cardíac Catalan Srdeční cyklus Czech Hjertecyklus Danish Ciclo cardíaco Spanish Bihotz-ziklo Basque چرخه قلبی Persian Cycle cardiaque French हृदय चक्र Hindi
| Cardiac cycle | |
|---|---|
| Organisms | Animalia |
| Biological system | Circulatory system |
| Health | Beneficial |
| Action | Involuntary |
| Method | Blood is allowed to enter relaxed ventricle chamber from vein through venous valve. Heart muscle contracts ventricle and blood is expelled through arterial valve to artery. |
| Outcome | Circulation of blood per minute (Humans) |
| Duration | 0.6–1 second (Humans) |
| *Animalia with the exception of Porifera, Cnidaria, Ctenophora, Platyhelminthes, Bryozoan, Amphioxus. | |


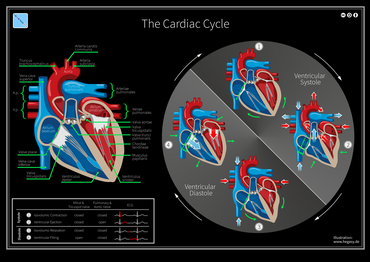
The cardiac cycle is the performance of the human heart from the beginning of one heartbeat to the beginning of the next.[1] It consists of two periods: one during which the heart muscle relaxes and refills with blood, called diastole, following a period of robust contraction and pumping of blood, called systole.[1] After emptying, the heart relaxes and expands to receive another influx of blood returning from the lungs and other systems of the body, before again contracting to pump blood to the lungs and those systems.
Assuming a healthy heart and a typical rate of 70 to 75 beats per minute, each cardiac cycle, or heartbeat, takes about 0.8 second to complete the cycle.[2][3] Duration of the cardiac cycle is inversely proportional to the heart rate.[4]
- ^ a b c Pollock JD, Makaryus AN (3 October 2022). "Physiology: Cardiac cycle". StatPearls Publishing, US National Library of Medicine. Retrieved 28 March 2024.
- ^ a b Silverthorn, DU (10 November 2022). "Constructing the Wiggers diagram using core concepts: a classroom activity". Advances in Physiology Education. 46 (4). doi:10.1152/advan.00046.2022.
- ^ Gersh, Bernard J (2000). Mayo Clinic Heart Book. New York: William Morrow. pp. 6–8. ISBN 0-688-17642-9.
- ^ Hall JE, Hall ME (2011). Guyton and Hall Textbook of Medical Physiology (12th ed.). Philadelphia: Elsevier. pp. 104–105. ISBN 978-1-4160-4574-8.
