Back Елипса на деформациите Bulgarian Indicatriu de Tissot Catalan Tissotova indikatrix Czech Tissotsche Indikatrix German Indicatriz de Tissot Spanish Indicatrice de Tissot French מחוון טיסו HE Indicatore di Tissot Italian テイソーの指示楕円 Japanese 티소 타원 Korean


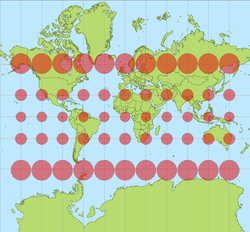
In cartography, a Tissot's indicatrix (Tissot indicatrix, Tissot's ellipse, Tissot ellipse, ellipse of distortion) (plural: "Tissot's indicatrices") is a mathematical contrivance presented by French mathematician Nicolas Auguste Tissot in 1859 and 1871 in order to characterize local distortions due to map projection. It is the geometry that results from projecting a circle of infinitesimal radius from a curved geometric model, such as a globe, onto a map. Tissot proved that the resulting diagram is an ellipse whose axes indicate the two principal directions along which scale is maximal and minimal at that point on the map.
A single indicatrix describes the distortion at a single point. Because distortion varies across a map, generally Tissot's indicatrices are placed across a map to illustrate the spatial change in distortion. A common scheme places them at each intersection of displayed meridians and parallels. These schematics are important in the study of map projections, both to illustrate distortion and to provide the basis for the calculations that represent the magnitude of distortion precisely at each point. Because the infinitesimal circles represented by the ellipses on the map all have the same area on the underlying curved geometric model, the distortion imposed by the map projection is evident.
There is a one-to-one correspondence between the Tissot indicatrix and the metric tensor of the map projection coordinate conversion.[1]
- ^ Goldberg, David M.; Gott III, J. Richard (2007). "Flexion and Skewness in Map Projections of the Earth" (PDF). Cartographica. 42 (4): 297–318. arXiv:astro-ph/0608501. doi:10.3138/carto.42.4.297. S2CID 11359702. Retrieved 2011-11-14.